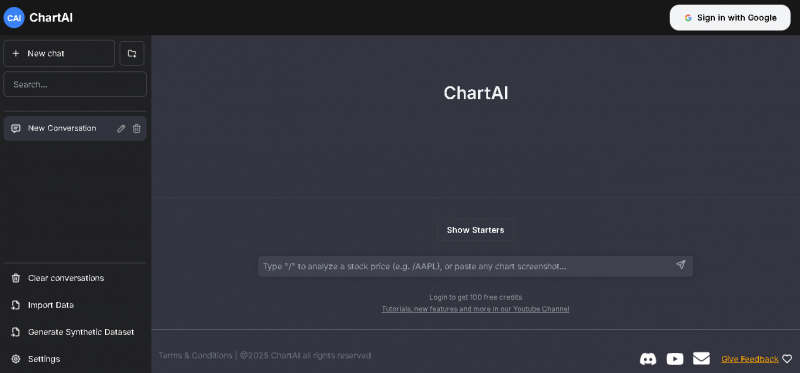
ChartAI is an intelligent data visualization platform that leverages artificial intelligence to help businesses, marketers, analysts, and educators transform raw data into clear, actionable charts and graphs. By automating chart selection, design, and formatting, ChartAI makes data storytelling faster, more accurate, and visually compelling.
• Conversational interface that speaks “data language”
• Instant chart creation with minimal input
• Works without code, formulas, or SQL
• Designed for both novice and experienced users
| Plan | Price | What’s Included |
|---|---|---|
| Free | Free forever | Basic queries and charts |
| Pro | $19/month | Unlimited queries, export visuals |
| Team | Custom pricing | Team seats + collaboration features |
Supports ER, Gantt, timelines, mind maps.
Handles classic charts plus heat maps.
Can import data or auto‑generate samples.
GPT‑based engine helps shape diagrams.
Optimizes layouts, dependencies, user journeys.
Customizable dashboard and chart workspace.
Advanced options overwhelm brand‑new users.
Online‑only; no strong offline mode yet.
Collaboration not truly real‑time multi‑editor.
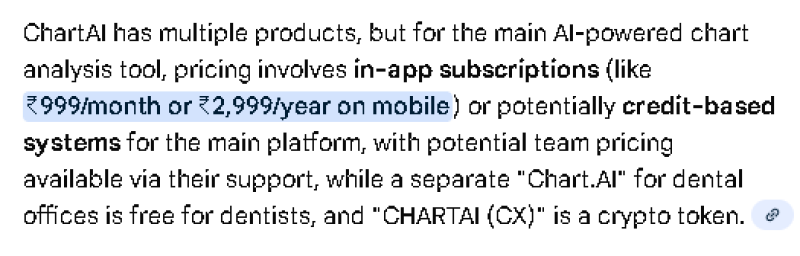
*Price last updated on Feb 5, 2026. Visit chartai.io's pricing page for the latest pricing.