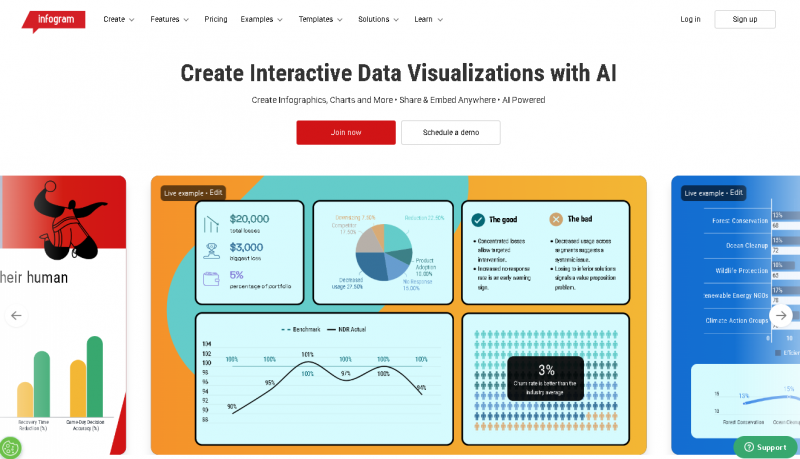
Infogram AI is a powerful data visualization and interactive content creation platform designed to help businesses, marketers, journalists, and educators present data in a visually compelling and easy-to-understand format. By integrating artificial intelligence into its design workflows, Infogram AI enables users to transform raw data into professional charts, dashboards, infographics, and reports with minimal effort.
Core Features of Infogram AI
Optimized User Experience and Productivity
The intuitive drag-and-drop interface combined with AI guidance reduces complexity and speeds up content creation. Users can produce polished, interactive visuals without advanced technical or design knowledge.
Infogram is highly intuitive, allowing even beginners to create professional-looking visualizations quickly.
Drag-and-drop design and interactive charts make building presentations and infographics faster than traditional design tools.
The platform offers a wide selection of templates, icons, and graphical elements that speed up the design process.
Importing spreadsheet data and turning it into charts or maps is straightforward, saving time and effort.
Interactive features like maps, timelines, and responsive charts help make content more engaging for audiences.
Many users find Infogram can replace more complex software, letting teams produce professional visuals efficiently.
The free version has limited functionality, including watermarks and restricted download or export options.
Customer support and billing practices have been criticized for issues like auto-renewals and slow responses.
Customization options for layouts, fonts, and advanced visuals are somewhat limited for experienced designers.
Performance and usability may be compromised on mobile devices or older hardware, making editing more difficult.


*Price last updated on Jan 12, 2026. Visit visily.ai's pricing page for the latest pricing.